4th Year of Global Cooling, NOAA Says
I was reading over some discussion of the Climate Change Timeline, and realized that people are failing to notice the most important news it contains:
We are, according to NOAA, currently in our fourth year of global cooling.
This is even more significant than the 114 year cycle of taking each minor change in temperature and projecting ice ages or global warming four different times.
NOAA and NASA avoid actually saying this, because they have a lot invested in profiting from global warming…but their own data say the earth is cooling, and has been for years. I will show this below, using their own numbers, without any changes made to them. I just don’t cut it off the details in the middle of the decade, like they do. I’m too honest.
Why Stop Reporting Temperature Changes?
You’ve probably seen that scary chart they like to show, where the temperature climbs way to the top. It’s pretty much everywhere on their side.
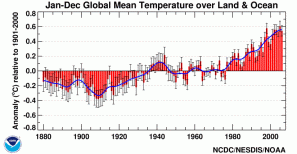
Here’s NOAA’s copy:

Notice that NOAA is still stopping their chart in 2006, although they have had data up to 2008 for a long time
Notice that its dates are very vague, and that it stops in the middle of this decade, with the very last temperature actually declining a bit. You may need to click it to see the large version.
The big problem with the chart, hidden by the vague dating, is that it ends in 2006. I have been unable to find a NOAA chart that actually includes the last two years of data.
This makes no sense, because they have data all the way up to the beginning of 2009, and have for a long time.
Here is the data that is used in that chart, on NOAA’s own site.
All you hear about, these days, is that each new year is “one of the ten warmest on record”. But that is a spin on their data…2006, 2007, and 2008 were each cooler than the year before. Why not mention this cooling trend?
The Coldest Year Since 2000
Here, on the left, is NOAA’s global mean temp for each of the past 10 years. They measure this in ten thousandths of one degree from the 100 year average:

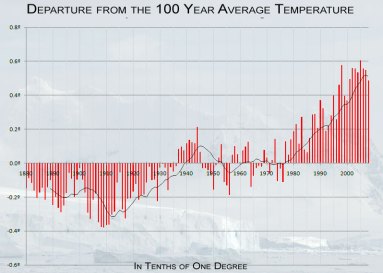
In this chart, using NOAA Climatologist data with clearer formatting, you can see that we are in a four year cooling trend, right now. Also notice that this entire chart encompasses barely more than one half of one degree. Click to zoom in for fine detail.
1998 0.5969
1999 0.4198
2000 0.3885
2001 0.5188
2002 0.5738
2003 0.5811
2004 0.5409
2005 0.6128
2006 0.5599
2007 0.5459
2008 0.4793
Blue is cooling, red is warming.
Why do those who are profiting from the global warming industry describe 2008 as one of the ten warmest years on record, instead of as the coldest year since 2000?
You can also see this, if you zoom in, on the chart at the right.
By the way, the trendline added in black is calculated from their data as an 11 year moving average, which makes sense to use just in case the sun is actually influencing temperatures on our planet. It is therefore very slow to show a reversal in trend…see how it falls behind the change in every other case. Yet it’s now showing a cooling trend, at the far right.
With the numbers on the left, you can see it is not only growing cooler, each year since 2005, but that it cooled fastest in 2008. If we graphed this trend, 0, -529, -140, -646…the curve says we should be in an actual ice age by 2020 or so. I did that last bit in my head, but if you work it out formally, send me a copy.
The Next Ice Age?

Why do we hear about unusually warm local weather, but not unusually cold? The warming of the Arctic, but not the record ice of the Antarctic? The melting of specific glaciers, but not the last two unusually cold years in the US? Unusually bad hurricane seasons, but not unusually mild ones?
By the way, don’t actually worry about that cooling trend, yet. Real scientists know that static analysis is worse than useless. You can’t just take any four data points and assume they will go on that way forever. If you do that, you end up looking as foolish as “we have 20 years until the end of civilization” crackpots Thomas Maltus and Paul Ehrlich.
On the other hand, EVERY time you have a reversal of three points in the same new direction, on the above chart, it turns out to be a reversal in the overall trend.
For example, 2005-2008 is a mirror image of 1909-1913, where the cooling had reached its peak, and the global mean was about to move toward warming.
And, overall, global cooling is worse for humanity and civilization than global warming.
Whether by coincidence or not, many failures of civilizations and economies have appeared to hinge around sudden cooling periods. There is no corresponding evidence of warming bringing down societies.
Regardless of what the actual temperature trend is, if anything, or what actually is causing it, the motivation of people who report every year the global temperature rises, but are silent every year it falls, seems worse than suspect.
These people are no more to be trusted than a tobacco scientist, and for the same reason.


Statisticians beg to differ
and this is a very telling analysis of US highs and lows that also rebukes your argument
I have already debunked that, in a different comment.
But surely…now that the huge array of emails from climatologists, coordinating their fraudulent global warming scams…have been made public, you blindly faithful are going to be as disillusioned as a gradeschooler discovering there’s no land at the North Pole for Santa to live on.
Are you ACTUALLY going to try to defend this, when those emails actually acknowledge hiding the global cooling trend?
What happened to my previous comment? Are you censoring people who point out your mistakes? Your reply to Adam R was not even a logical rebuttal, “It’s happened before,so I am correct this time”,since it has nothing to do with the fact that your cherry picked data is in fact cherry picked to make a molehill appear to be a mountain . If you did delete my comment,then you are no different from the GW scare mongers.Shame!
If you’d paid closer attention, the system should tell you that your post was automatically held for moderation, because you’re a new user.
I have had…hang on…439 automated spam “comments” posted in the past few months, and 358 posts by actual human beings. WordPress therefore holds unvalidated users’ comments for me to verify as being real.
That was my mistake and I apologise for it. My reaction was reflexive as other blogs tend to automatically delete comments that do not agre with their own,esp on this subject.
Sorry about the accusation again.
You are picking a microtrend within a macrotrend,and hence your conclusions are not accurate at all.For example,look at the period between 1980 to 1990. There was a micro trend of what appeared to be cooling during the ~1982 -1986 period ,yet overall the temp increase trend has always been upwards since 1980.A few years of ‘dipping’ does not invalidate the overall trend of temp increase.You start off at 1980 and reach a point at 2000 – 20 year window of observation which indicates increase in warming.But then from 2005 to 2009, there is an annual cooling.A 4 year micro trend within a total 29 year window -cherry picking that is scientifically useless.
Note: My observation of your major error has nothing to do with my political stance. Global warming aka climate change is occuring,however the charge that it is all due to Human activity is garbage.
All trends on the 115 year timeline are microtrends.
That is the problem with the myth of global warming.
Actual climate trends involve millennia, not decades.
As I noted, EVERY time in the 115 year timeline that a trend reversed for three years in a row, it stayed reversed entirely.
Every reversal starts out as a small trend, until more years pass and it becomes obviously the overall change.
That is the likely way things are going, now.
But, most importantly, what you argue illustrates the lie of the entire “climate change” panic in the first place.
Oh, and no, “global warming” is not “occurring”, in the way sense that the climatologists imply. This is because they are talking only about surface temperatures around climate stations. The actual, overall temperature of the planet is actually much more stable than those little, land-based stations.
Coldest Michigan summer that I remember out of nearly 50 years. Turn the heat on or you would have died of cold exposure at night in your sleep. Carbongate: biggest scam enslavement so far.
Talk about not seeing the forest for the trees!
Amazing that you can post these graphs and not see what is obvious about climate: a 4-year period is meaningless in the general trend. And look what happens after *every* peak for the past 45 years: a brief slowing in warming, then the march upwards continues.
The graphs contain many short periods that can be cherry picked to show cooling or heating. Even the blue trend lines will waver due to short term influences, but which way are they headed in general?
Adam, look at the chart:
EVERY SINGLE TIME, in the past 114 years, that the temperature change has gone against the previous trend three or more years in a row, it has reversed completely.
EVERY TIME.
There is not one example of a three year reversal not becoming a trend.
If this were 1912, you’d be saying “look how the overall trend is such a deep cooling one, on the graph!
But it was about to move into a deep warming trend. And now it’s going the other way.
This is why the global warming profiteers have started frantically claiming there is going to be an “anomalous” cooling for the next few years, before global warming “resumes”.
[…] […]
Pingback by Boxer and Kerry Unveil New Devastating Energy Tax - Politics and Other Controversies - Page 3 - City-Data Forum | October 1, 2009 |
[…] it into Excel or whatever, and see for yourself. I use an 11 year moving average trendline here: 4th Year of Global Cooling, NOAA Says But Now You Know and still the trend is now downward. And you can see (second chart) that this process ALWAYS […]
Pingback by Climate change is a religious belief - Page 6 | September 28, 2009 |
[…] bureaucrats, proclaiming their certainty that humans are causing global warming while we are in our fourth year in a row of accelerating cooling, have exactly the same motivation…and credibility…as a tobacco scientist touting the benefits […]
Pingback by Obama demands we work to change climate, despite no evidence man can change it - Politics and Other Controversies - Page 4 - City-Data Forum | September 23, 2009 |
[…] These guys proclaiming their certainty that humans are causing global warming while we are in our fourth year in a row of accelerating cooling have exactly the same motivation…and credibility…as a tobacco scientist touting the benefits of […]
Pingback by Obama demands we work to change climate, despite no evidence man can change it - Politics and Other Controversies - Page 4 - City-Data Forum | September 23, 2009 |
Even as the world is cooling down, global-warming hysteria is heating up:
http://www.foxnews.com/politics/2009/09/22/obama-climate-change-irreversible-catastrophe-addressed/
This has been the coolest summer I can recall in the Wash DC area (since moving here in the early 70s). July was like spring. August was hot, but not the usual. And since September began, the nights and mornings are down right chilly; yet Sept is usually about as hot as August. Some leaves are already turning as people walk around in fall jackets.
Not at all surprising.